Thủ Phủ Hacker Mũ Trắng Buôn Ma Thuột

Chương trình Đào tạo Hacker Mũ Trắng Việt Nam tại Thành phố Buôn Ma Thuột kết hợp du lịch. Khi đi là newbie - Khi về là HACKER MŨ TRẮNG !

Hacking Và Penetration Test Với Metasploit

Chương trình huấn luyện sử dụng Metasploit Framework để Tấn Công Thử Nghiệm hay Hacking của Security365.

Tài Liệu Computer Forensic Của C50

Tài liệu học tập về Truy Tìm Chứng Cứ Số (CHFI) do Security365 biên soạn phục vụ cho công tác đào tạo tại C50.

Sinh Viên Với Hacking Và Bảo Mật Thông Tin

Cuộc thi sinh viên cới Hacking. Với các thử thách tấn công trang web dành cho sinh viên trên nền Hackademic Challenge.

Tấn Công Và Phòng Thủ Với BackTrack / Kali Linux

Khóa học tấn công và phòng thủ với bộ công cụ chuyên nghiệp của các Hacker là BackTrack và Kali LINUX dựa trên nội dung Offensive Security

Sayfalar

Showing posts with label Gathering. Show all posts

CountryTraceRoute v1.22 - Fast Traceroute with IP country information


CountryTraceRoute is a Traceroute utility, similar to the tracert tool of Windows, but with graphical user interface, and it's also much faster than tracert of Windows. CountryTraceRoute also displays the country of the owner of every IP address found in the Traceroute. 

After the Traceroute is completed, you can select all items (Ctrl+A) and then save them into csv/tab-delimited/html/xml file with 'Save Selected Items' option (Ctrl+S) or copy them to the clipboard (Ctrl+C) and then paste the result into Excel or other spreadsheet application.

System Requirements

This utility works on any version of Windows, starting from Windows 2000 and up to Windows 8. Both 32-bit and x64 systems are supported.


Inxi - A newer, better system information script for irc, administration, and system troubleshooters


A newer, better system information script for irc, administration, and system troubleshooters.

Inxi Options

Inxi has a wide range of options and custom triggers, along with useful defaults like -b or -F. Plain inxi, no options, prints a single line of basic system information.

Here is a screenshot of typical output for inxi -Fz (-z filters certain output like IP numbers and Mac address of network card, things that don't need to be publically displayed for security reasons). The display output has changed slightly as of 1.7.x:

Full List of Inxi Options
  • inxi supports the following options. These options are included as of inxi 2.2.20. Earlier versions may not have every option. You can combine these options, or list them one by one: Examples: inxi -v4 -c6 OR inxi -bDc 6
  • If you start inxi with no arguments, it will show the short form. The following options if used without -b, -F or -v + number will show just that complete line:
    • A, C, D, G, I, M, N, P, R, S, f, i, n, o, p, l, u, r, s, t, w, W - you can use these together or alone to show just the line(s) you want to see.
    • If you use them with either a -v + level, a -b, or with -F, it will show the full output for that line along with the output for the chosen verbosity level.
    • NOTE: as of version 1.6.5, the old basic output option -d was changed to -b, for basic. -d is now used for the extended disk option, showing cdrom/dvd information as well.
  • Output Control Options:
    • -A Show Audio/sound card information.
    • -b Shows basic (b for basic - version 1.7.5 or later. Earlier versions used: -d) output, short form. Similar to inxi -v 2. Shows -S -M -C -G -N -D and -R (short forms), and -I. -R does not show if no raid devices found.
    • -c Available color schemes. Scheme number is required. Color selectors run a color selector option prior to inxi starting which lets you set the config file value for the selection.
      • Supported color schemes: 0-32 Example: inxi -c 11
        • Note: if you want to turn off all script colors, use -c 0 This is useful if you are for example piping output and don't want the color code characters.
      • Supported color selectors. NOTE: irc and global only show safe color set. (version 1.5.x or later only)
        • 94 - Console, out of X
        • 95 - Terminal, running in X - like xTerm
        • 96 - Gui IRC, running in X - like Xchat, Quassel, Konversation etc.
        • 97 - Console IRC running in X - like irssi in xTerm
        • 98 - Console IRC not in X
        • 99 - Global - Overrides/removes all settings. Setting specific removes global.
    • -C Show full CPU output, including per CPU clockspeed.
    • -D Show full hard Disk info, not only model, ie: /dev/sda ST380817AS 80.0GB.
    • -f Show all cpu flags used, not just the short list. Not shown with -F to avoid spamming.
    • -F Show Fuller output for inxi, includes all upper case line arguments, plus -n and -s. Does not show extra verbose options like -d -f -u -l -p -t or -o unless you add them explicitly, for example: -Fplo
    • -G Show Graphic card information (card, x type, resolution, version). Also shows glx renderer, card pci busID with -x. Shows active/unloaded/failed driver versions (1.5.x or later)
    • -i Show Wan IP address, and shows local interfaces (requires ifconfig network tool). Same as -Nni
      • If you are going to use this for public posting of your data, consider running it with the -z option for filtering. IRC filters by default.
    • -I (upper case i) Show Information: processes, uptime, memory, irc client, inxi version.
    • -l (lower case l, el) Show partition labels. Default: short partition -P. For full -p output, use: -pl (or -plu).
    • -M Show machine data. Motherboard, Bios, and if present, System Builder (Like Lenovo) (version 1.6.x and later). Older systems/kernels without the required /sys data can use dmidecode instead, run as root. -! 33 forces use of dmidecode, which might be of some utility in certain fringe cases where dmidecode has more data than /sys.
    • -n Show Advanced Network card information. Same as -Nn. Shows interface, speed, mac id, state (version 1.5.x and later).
    • -N Show Network card information. Shows card and driver. Includes support for USB networking devices. Also shows busID/USB-ID, ports, driver version with -x
    • -o Show unmounted partition information (includes UUID and LABEL if available).
      • Shows file system type if you have file installed, if you are root OR if you have added to /etc/sudoers (sudo v. 1.7 or newer):
        • < username > ALL = NOPASSWD: /usr/bin/file (sample)
    • -p Show full partition information (-P plus all other detected partitions).
    • -P Show Partition information (shows what -v 4 would show, but without extra data).
      • Shows, if detected: / /boot /home /tmp /usr /var. Use -p to see all mounted partitions.
    • -r Show distro repository data. Currently supported repo types:
      • APT (Debian, Ubuntu + derived versions)
      • PACMAN (Arch Linux + derived versions)
      • PISI (Pardus + derived versions)
      • URPMQ (Mandriva, Mageia + derived versions)
      • YUM. (Fedora, Redhat, maybe Suse + derived versions)
      • (as distro data is collected more will be added. If your's is missing please show us how to get this information and we'll try to add it.)
    • -R Show RAID data. Shows RAID devices, states, levels, and components, and extra data with -x/-xx. If device is resyncing, shows resync progress line as well.
    • -s Show sensors output (if sensors installed/configured): mobo/cpu/gpu temp; detected fan speeds.
      • Gpu temp only for Fglrx/Nvidia drivers. Nvidia shows screen number for > 1 screens
    • -S Show System information: host name, kernel, desktop, desktop version (plus toolkit if -x used), distro (desktop features, version 1.5.x or later)
    • -t Show processes. Requires extra options: c (cpu) m (memory) cm (cpu+memory).
      • If followed by numbers 1-20, shows that number of top process for each selection (default: 5):
      • Examples:
        • -t cm10 (shows top 10 cpu and memory processes, 20 in all)
        • -t c (shows top 5 cpu processes)
        • -t m20 (shows top 20 memory processes)
        • -t cm (shows top 5 cpu and memory processes, 10 in all)
      • Make sure to have no space between letters and numbers (cm10 -right, cm 10 - wrong).
    • -u Show partition UUIDs. Default: short partition -P. For full -p output, use: -pu (or -plu).
    • -v Script verbosity levels. Verbosity level number is required. Note: do not mix -v options with -b or -F, use one or the other.
      • Supported levels: 0-7 Example: inxi -v 4
        • 0 - short output, same as: inxi
        • 1 - Basic verbose. Roughly the same as the old -d,
        • 2 - Adds networking card (-N), Machine (-M) data, and shows basic hard disk data (names only), and basic raid (devices only, and if inactive, notes that). Similar to inxi -b
        • 3 - Adds advanced CPU (-C), network (-n) data, and switches on -x advanced data option.
        • 4 - Adds partition size/filled data (-P) for (if present):/, /home, /var/, /boot. Shows full disk data (-D)
        • 5 - Adds audio card (-A); sensors (-s), partition label (-l) and UUID (-u), short form of optical drives, and standard raid data (-R).
        • 6 - Adds full partition data (-p), unmounted partition data (-o), -d full disk data, including CD/DVD information.
        • 7 - Adds network IP data (-i); triggers -xx.
    • -w Local weather data/time. To check an alternate location, see: -W location. For extra weather data options see -x, -xx, and -xxx.
    • -W location - location supported options: postal code; city,[state/country]; latitude,longitude. Only use if you want the weather somewhere other than the machine running inxi. Use only ascii characters, replace spaces in city/state/country names with +: new+york,ny
    • -x Show extra data:
      • -C - Bogomips on Cpu; CPU flags short list
      • -d - Shows more information if present on cd/dvd devices.
        • -D - Shows hdd temp with disk data if you have hddtemp installed, if you are root OR if you have added to /etc/sudoers (sudo v. 1.7 or newer):
          • < username > ALL = NOPASSWD: /usr/sbin/hddtemp (sample)
      • -G - Direct rendering status for Graphics (in X). Only works with verbose or line output;
      • -G - Shows (for single gpu, nvidia driver) screen number gpu is running on.
      • -i - Show IPv6 as well for LAN interface (IF) devices.
      • -I - Show system GCC, default. With -xx, also show other installed GCC versions. Show Init type, if detected, like systemd, Upstart, SysVinit, init (bsd), Epoch, runit. Show runlevel/target if present.
      • -N, -A - driver version (if available) for Network/Audio;
      • -N, -A - Shows port for card/device, if available.
      • -N -A -G - Shows pci Bus ID / Usb ID for Audio, Network, Graphics
      • -R - Shows component raid id. Adds second RAID Info line: raid level; report on drives (like 5/5); blocks; chunk size; bitmap (if present). Resync line, shows blocks synced/total blocks.
      • -S - Shows toolkit (QT or GTK) if GNOME, KDE, or XFCE. Shows kernel gcc version.
      • -t - Adds memory use output to cpu (-xt c, and cpu use to memory (-xt m).
      • -w/-W - Wind speed and time zone (time zone, -w only).
    • -xx Show extra, extra data (only works with verbose or line output, not short form). You can also trigger it with -Fx (but not -xF) (Version 1.6.x and later)
      • -D - Adds disk serial number.
      • -I - Adds other detected installed gcc versions to primary gcc output (if present). Shows init type version if found, and default runlevel/target if found.
      • -M - Adds chassis information, if any data for that is available.
      • -N -A -G - Shows vendor:product ID for Audio, Network, Graphics
      • -R - Adds superblock (if present); algorythm, U data. Adds system info line (kernel support, read ahead, raid events). Adds if present, unused device line. Resync line, shows progress bar.
      • -w/-W - Humidity, barometric pressure.
      • -xx -@ [11-14] - Automatically uploads debugger data tar.gz file to ftp.techpatterns.com.
    • -xxx Show extra, extra, extra data (only works with verbose or line output, not short form):
      • -S - Panel/shell information in desktop output, if in X (like gnome-shell, cinnamon, mate-panel).
      • -w/-W - Location (uses -z/irc filter), weather observation time, wind chill, heat index, dew point (shows extra lines for data where relevant).
    • -y (plus integer >= 80) This is an absolute width override which sets the output line width max. Overrides COLS_MAX_IRC / COLS_MAX_CONSOLE globals, or the actual widths of the terminal. If used with -h or -c 94-99, put -y option first or the override will be ignored. Cannot be used with --help / --version / --recommends type long options. Example: inxi -y 130 -Fxx
    • -z Adds security filters for IP addresses, Mac, and user home directory name. Default on for irc clients.
    • -Z Absolute override for output filters. Useful for debugging networking issues in irc for example.
  • Additional Options:
    • -h, --help This help menu.
    • -H - This help menu, plus developer options. Do not use dev options in normal operation!
    • --recommends Checks inxi application dependencies + recommends, and directories, then shows what package(s) you need to install to add support for that feature (version 1.6.6 and later).
    • -U Auto-update script. Note: if you installed as root, you must be root to update, otherwise user is fine.
    • -V, --version inxi version information. Prints information then exits.
    • -% Overrides defective or corrupted data.
    • -@ Triggers debugger output. Requires debugging level 1-13 (8-10 - logging). Less than 8 just triggers inxi debugger output on screen.
      • 1-7 - On screen debugger output
      • 8 - Basic logging
      • 9 - Full file/sys info logging
      • 10 - Color logging.
      • The following create a tar.gz file of system data, plus collecting the inxi output to file. To automatically upload debugger data tar.gz file to ftp.techpatterns.com: inxi -xx@ [11-14] For alternate ftp upload locations: Example: inxi -! ftp.yourserver.com/incoming -xx@ 14
        • 11 - With data file of xiin read of /sys.
        • 12 - With xorg conf and log data, xrandr, xprop, xdpyinfo, glxinfo etc.
        • 13 - With data from dev, disks, partitions etc.
        • 14 - Everything, all the data available.
    • -! 31 - Turns off hostname in output. Useful if showing output from servers etc.
    • -! 32 - Turns on hostname in output. Overrides global B_SHOW_HOST='false'
    • -! 33 - Force use of dmidecode. This will override /sys data in some lines, like -M. 

Automater v2.0 - URL/Domain, IP Address, and Md5 Hash OSINT Tool


Automater is a URL/Domain, IP Address, and Md5 Hash OSINT tool aimed at making the analysis process easier for intrusion Analysts. Given a target (URL, IP, or HASH) or a file full of targets Automater will return relevant results from sources like the following: IPvoid.com, Robtex.com, Fortiguard.com, unshorten.me, Urlvoid.com, Labs.alienvault.com, ThreatExpert, VxVault, and VirusTotal.

*Automater is installed on HoneyDrive and Kali by default but currently have an outdated version.

Installation:
Automater comes in two  flavors, python script that will work for Linux or Windows, and an exe for Windows.

Windows:
The Windows client is currently in development. In the meantime the python code will work on Windows with a python 2.7 install

Linux:
As this is a python script you will need to ensure you have the correct version of python, which for this script is python 2.7. I used mostly standard libraries, but just incase you don't have them, here are the libraries that are required: httplib2, re, sys, argparse, urllib, urllib2

With the python and the libraries out of the way, you can simply use git to clone the tekdefense code to your local machine.
git clone https://github.com/1aN0rmus/TekDefense-Automater.git

Usage:
Once installed the usage is pretty much the same across Windows, Linux, and Kali.
python Automater.py -h

or if you chmod +x Automater.py you can


./Automater.py -h

usage: Automater.py [-h] [-o OUTPUT] [-w WEB] [-c CSV] [-d DELAY] [-s SOURCE]

[--p]

target


IP, URL, and Hash Passive Analysis tool


positional arguments:

target List one IP Addresses, URL or Hash to query or pass

the filename of a file containing IP Addresses, URL or

Hash to query each separated by a newline.


optional arguments:

-h, --help show this help message and exit

-o OUTPUT, --output OUTPUT

This option will output the results to a file.

-w WEB, --web WEB This option will output the results to an HTML file.

-c CSV, --csv CSV This option will output the results to a CSV file.

-d DELAY, --delay DELAY

This will change the delay to the inputted seconds.

Default is 2.

-s SOURCE, --source SOURCE

This option will only run the target against a

specific source engine to pull associated domains.

Options are defined in the name attribute of the site

element in the XML configuration file

--p This option tells the program to post information to

sites that allow posting. By default the program will

NOT post to sites that require a post.


Passive Spider - Information Gathering from Search Engine Tool

Passive Spider uses search engines (currently only Bing supported) to find interesting information about a target domain.

INSTALL
git clone https://github.com/RandomStorm/passive-spider.git
cd passive-spider
gem install bundler && bundle install
Place your search engine API keys in the api_keys.config file. Each search engine API has different usage limits and pricing, refer to them for this information. Do not share your keys.
Tested on Mac OS X with Ruby 1.9.3 & Ruby 2.1.2.

ARGUMENTS

--domain   || -d    The domain you would like to use as a target.
--pages || -p The number of pages you would like to hit from the search engine. Default: 10
--all || -a Do all of the spidering checks. This is the default check.
--allpages Find all pages related to the domain, limited by the --pages option.
--allfiles Find all file types related to the domain, limited to the ones configured.
--neighbours Find other domains that are on the same IP address.
--urlkeywords Find page URLs that have 'interesting' keywords in them.
--keywords Find page content that have 'interesting' keywords in them.
--export || -e Request URLs through proxy.
Specify a proxy (type://ip:port) or use defaults. Default: http://127.0.0.1:8080
--help || -h This output.

USAGE

- Run all checks against the given domain...
ruby pspider.rb -d www.example.com

- Run all checks against the admin subdomain...
ruby pspider.rb -d admin.example.com

- Run all checks against the given domain, limited to 50 search engine pages...
ruby pspider.rb -d www.example.com -p 50

- Run the IP Neighbour check against the given domain...
ruby pspider.rb -d www.example.com --neighbours


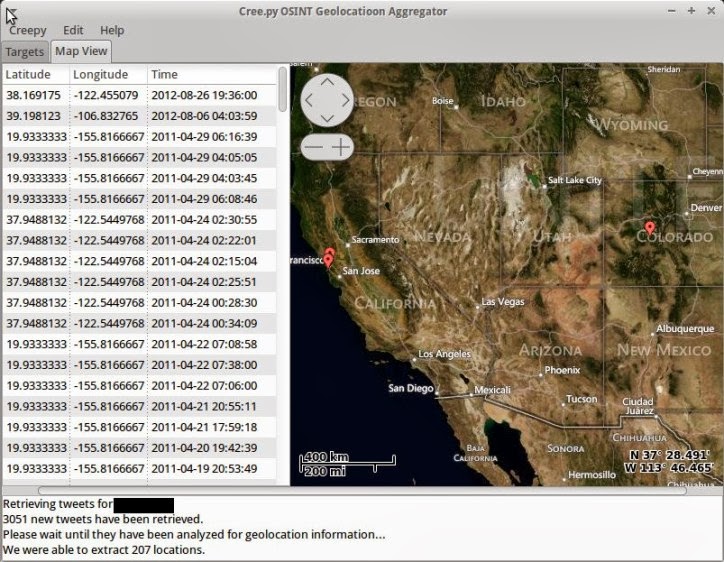
[Creepy] Geolocation information Gathering through Social Networking Platforms


Creepy is a geolocation OSINT tool. Gathers geolocation related information from online sources, and allows for presentation on map, search filtering based on exact location and/or date, export in csv format or kml for further analysis in Google Maps.

What's new in v1.0.x ?

  • Creepy now uses Qt 4, via it's PyQt4 bindings for the user interface.
  • Analysis in based on projects, you can work with multiple targets simultaneously without having to re-analyze them.
  • Creepy is extensible via plugins for online services that might hold geolocation information. See Creepy Plugins Repository
  • Plugins for twitter, instagram and flickr are included in this release
  • Easy plugin configuration with wizards, where applicable
  • After analysis, the retrieved locations can be filtered based on the date that they were created or the proximity to a certain location
  • Google maps is used as a maps provider ( Street view included within Creepy ! )

Quick Start Instructions

  • Download creepy ( source code or the installers provided here for your platform )
  • Configure twitter and instagram plugins. Edit -> Plugins Configuration -> Twitter / Instagram and run the wizards, following the instructions
  • Create a new project : Creepy -> New Project -> Person Based Project . Search for the target selecting the available plugins.
  • Right click on the project -> Analyze Current Project
  • Wait :)
  • The locations will be drawn on the map, once the analysis is complete.
  • Filter locations, export locations, view them on the map.

[TheHarvester v2.2] The Information Gathering Suite


The objective of this program is to gather emails, subdomains, hosts, employee names, open ports and banners from different public sources like search engines, PGP key servers and SHODAN computer database.

This tool is intended to help Penetration testers in the early stages of the penetration test in order to understand the customer footprint on the Internet. It is also useful for anyone that wants to know what an attacker can see about their organization.

This is a complete rewrite of the tool with new features like:
  • Time delays between request
  • All sources search
  • Virtual host verifier
  • Active enumeration (DNS enumeration, Reverse lookups, TLD expansion)
  • Integration with SHODAN computer database, to get the open ports and banners
  • Save to XML and HTML
  • Basic graph with stats
  • New sources
Passive discovery:
Google: google search engine - www.google.com
Google-profiles: google search engine, specific search for Google profiles
Bing: microsoft search engine - www.bing.com
Bingapi: microsoft search engine, through the API (you need to add your Key in the discovery/bingsearch.py file)
Pgp: pgp key server - pgp.rediris.es
Linkedin: google search engine, specific search for Linkedin users
Shodan: Shodan Computer search engine, will search for ports and banner of the discovered hosts 
Vhost: Bing virtual hosts search

Active discovery:
DNS brute force: this plugin will run a dictionary brute force enumeration
DNS reverse lookup: reverse lookup of ip´s discovered in order to find hostnames
DNS TDL expansion: TLD dictionary brute force enumeration
Please read the README file for more information. 

[LinEnum v0.2] Automating local information gathering tasks on Linux hosts


LinEnum is a shell script that automates local information gathering tasks on Linux hosts.Over 65 checks are performed, obtaining anything from kernel information to locating possible escalation points such as potentially useful SUID/GUID files and Sudo/rhost mis-configurations etc.

Additionally, the script will also use a provided keyword to search through *.conf and *.log files. Any matches will be displayed along with the full file path and line number on which the keyword was identified (useful for finding ‘password’ and other sensitive data).


High-level summary of the checks/tasks performed by LinEnum:
  • Kernel and distribution release details
  • System Information:
    • Hostname
    • Networking details:
    • Current IP
    • Default route details
    • DNS server information
  • User Information:
    • Current user details
    • Last logged on users
    • List all users including uid/gid information
    • List root accounts
    • Checks if password hashes are stored in /etc/passwd
    • Extract full details for ‘default’ uid’s such as 0, 1000, 1001 etc
    • Attempt to read restricted files i.e. /etc/shadow
    • List current users history files (i.e .bash_history, .nano_history etc.)
    • Basic SSH checks
  • Privileged access:
    • Determine if /etc/sudoers is accessible
    • Determine if the current user has Sudo access without a password
    • Are known ‘good’ breakout binaries available via Sudo (i.e. nmap, vim etc.)
    • Is root’s home directory accessible
    • List permissions for /home/
  • Environmental:
    • Display current $PATH
  • Jobs/Tasks:
    • List all cron jobs
    • Locate all world-writable cron jobs
    • Locate cron jobs owned by other users of the system
  • Services:
    • List network connections (TCP & UDP)
    • List running processes
    • Lookup and list process binaries and associated permissions
    • List inetd.conf/xined.conf contents and associated binary file permissions
    • List init.d binary permissions
  • Version Information (of the following):
    • Sudo
    • MYSQL
    • Postgres
    • Apache
    • Checks user config
  • Default/Weak Credentials:
    • Checks for default/weak Postgres accounts
    • Checks for default/weak MYSQL accounts
  • Searches:
    • Locate all SUID/GUID files
    • Locate all world-writable SUID/GUID files
    • Locate all SUID/GUID files owned by root
    • Locate ‘interesting’ SUID/GUID files (i.e. nmap, vim etc)
    • List all world-writable files
    • Find/list all accessible *.plan files and display contents
    • Find/list all accesible *.rhosts files and display contents
    • Show NFS server details
    • Locate *.conf and *.log files containing keyword supplied at script runtime
    • List all *.conf files located in /etc
    • Locate mail

[theHarvester v2.2a] Tool for Gathering

theHarvester is a tool for gather emails, subdomains, hosts, employee names, open ports and banners from different public sources like search engines, PGP key servers and SHODAN computer database.


This tool is intended to help Penetration testers in the early stages of the penetration test in order to understand the customer footprint on the Internet. It is also useful for anyone that wants to know what an attacker can see about their organization.

This is a complete rewrite of the tool with new features like:

  • Time delays between request
  • All sources search
  • Virtual host verifier
  • Active enumeration (DNS enumeration, Reverse lookups, TLD expansion)
  • Integration with SHODAN computer database, to get the open ports and banners
  • Save to XML and HTML
  • Basic graph with stats
  • New sources
Passive discovery:
  • Google: google search engine – www.google.com
  • Google-profiles: google search engine, specific search for Google profiles
  • Bing: microsoft search engine – www.bing.com
  • Bingapi: microsoft search engine, through the API (you need to add your Key in the discovery/bingsearch.py file)
  • Pgp: pgp key server – pgp.rediris.es
  • Linkedin: google search engine, specific search for Linkedin users
  • Shodan: Shodan Computer search engine, will search for ports and banner of the discovered hosts (http://www.shodanhq.com/)
Vhost: Bing virtual hosts search
Active discovery:
  • DNS brute force: this plugin will run a dictionary brute force enumeration
  • DNS reverse lookup: reverse lookup of ip´s discovered in order to find hostnames
  • DNS TDL expansion: TLD dictionary brute force enumeration
More Information: